America the Beautiful Quarters Mintages
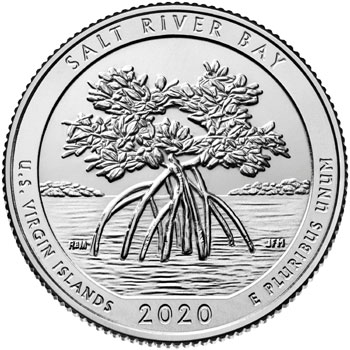
2020 Salt River Bay National Historical Park Quarter
2020 Salt River Bay National
Historic Park Quarter

During the course of the series, the United States Mint produced more than 18 billion America the Beautiful Quarters for circulation. The mintages for each issue varied widely from less than 50 million pieces for the Chaco Culture National Historical Park and Acadia National Park issues to more than 1 billion pieces for the Salt River Bay National Historical Park issue.

The differences in mintages were driven by the overall demand for new circulating coinage within the economy. The Federal Reserve Banks place coinage orders with the United States Mint based on the number of coins needed by depository institutions within their districts.

The table below contains the mintage figures for the America the Beautiful Quarters over the course of the program. A breakdown is provided for the coins produced at the Denver Mint and Philadelphia Mint, along with total combined production.

 IssueDenverPhiladelphiaTotal
2010 Hot Springs National Park34,000,00035,600,00069,600,000
2010 Yellowstone National Park34,800,00033,600,00068,400,000
2010 Yosemite National Park35,000,00035,000,00070,000,000
2010 Grand Canyon National Park35,400,00034,800,00070,200,000
2010 Mount Hood National Forest34,400,00034,400,00068,800,000
2011 Gettysburg National Military Park30,400,00030,800,00061,200,000
2011 Glacier National Park31,200,00030,400,00061,600,000
2011 Olympic National Park30,500,00030,500,00061,000,000
2011 Vicksburg National Military Park33,400,00030,800,00064,200,000
2011 Chickasaw National Recreation Area69,400,00073,800,000143,200,000
2012 El Yunque National Forest25,000,00025,800,00050,800,000
2012 Chaco Culture National Historical Park22,000,00022,000,00044,000,000
2012 Acadia National Park21,606,00024,800,00046,406,000
2012 Hawai’i Volcanoes National Park78,600,00046,200,000124,800,000
2012 Denali National Park and Preserve166,600,000135,400,000302,000,000
2013 White Mountain National Forest107,600,00068,800,000176,400,000
2013 Perry’s Victory and International Peace Memorial131,600,000107,800,000239,400,000
2013 Great Basin National Park141,400,000122,400,000263,800,000
2013 Fort McHenry National Monument151,400,000120,000,000271,400,000
2013 Mount Rushmore National Memorial272,400,000231,800,000504,200,000
2014 Great Smoky Mountains National Park99,400,00073,200,000172,600,000
2014 Shenandoah National Park197,800,000112,800,000310,600,000
2014 Arches National Park251,400,000214,200,000465,600,000
2014 Great Sand Dunes National Park and Preserve171,800,000159,600,000331,400,000
2014 Everglades National Park142,400,000157,601,000300,001,200
2015 Homestead National Monument of America248,600,000214,400,000463,000,000
2015 Kisatchie National Forest379,600,000397,200,000776,800,000
2015 Blue Ridge Parkway505,200,000325,616,000830,816,000
2015 Bombay Hook National Wildlife Refuge206,400,000275,000,000481,400,000
2015 Saratoga National Historical Park215,800,000223,000,000438,800,000
2016 Shawnee National Forest151,800,000155,600,000307,400,000
2016 Cumberland Gap National Historical Park223,200,000215,400,000438,600,000
2016 Harpers Ferry National Historical Park424,000,000434,630,000858,630,000
2016 Theodore Roosevelt National Park223,200,000231,600,000454,800,000
2016 Fort Moultrie142,200,000154,400,000296,600,000
2017 Effigy Mounds National Monument210,800,000271,200,000482,000,000
2017 Frederick Douglass National Historic Site185,800,000184,800,000370,600,000
2017 Ozark National Scenic Riverways200,000,000203,000,000403,000,000
2017 Ellis Island254,000,000234,000,000488,000,000
2017 George Rogers Clark National Historical Park180,800,000196,600,000377,400,000
2018 Pictured Rocks National Lakeshore182,600,000186,714,000369,314,000
2018 Apostle Islands National Lakeshore216,600,000223,200,000439,800,000
2018 Voyageurs National Park197,800,000237,400,000435,200,000
2018 Cumberland Island National Seashore151,600,000138,000,000289,600,000
2018 Block Island National Wildlife Refuge159,600,000159,600,000319,200,000
2019 Lowell National Historical Park182,200,000165,800,000348,000,000
2019 American Memorial Park182,600,000142,800,000325,400,000
2019 War in the Pacific National Historical Park114,400,000116,600,000231,000,000
2019 San Antonio Missions National Historical Park129,400,000142,800,000272,200,000
2019 Frank Church River of No Return Wilderness251,600,000223,400,000475,000,000
2020 National Park of American Samoa212,200,000286,000,000498,200,000
2020 Weir Farm National Historic Site155,000,000125,600,000280,600,000
2020 Salt River Bay National Historical Park515,000,000580,200,0001,095,200,000
2020 Marsh-Billings-Rockefeller National Historical Park345,800,000304,600,000650,400,000
2020 Tallgrass Prairie National Preserve142,400,000101,200,000243,600,000
2021 Tuskegee Airmen National Historic Site304,000,000160,400,000464,400,000
2021 Washington Crossing the Delaware865,400,000838,400,0001,703,800,000

Frequently Asked Questions

Which America the Beautiful Quarter has the lowest mintage?

The lowest-minted mint state America the Beautiful Quarter is the 2018-S Block Island National Wildlife Refuge Quarter, which has a mintage of 854,940. The lowest-minted Proof America the Beautiful Quarters are the 2020-S Silver Proof America the Beautiful Quarters, which each have a mintage of 427,191.

What is the mintage for America the Beautifuls?

The total mintage for the America the Beautiful Quarter is 20,250,367,200. Mintages for each issue of the America the Beautiful can be found by consulting the data above.

How many America the Beautifuls have been struck?

The U.S. Mint struck a total of 20,250,367,200 America the Beautiful Quarters from 2010 to 2021.

Where were America the Beautiful Quarters produced?

The U.S. Mint struck America the Beautiful Quarters at the Philadelphia, Denver, and San Francisco Mint facilities.

How many varieties of America the Beautiful Quarters were produced?

The U.S. Mint struck 2 varieties of the America the Beautiful Quarter.